On this page
Is there a free alternative to TradingView backtesting?
Yes. Backtesting does not have to sit behind a monthly plan. Strategy Backtester is a free online backtester that runs in your browser, so you can test a trading idea in minutes without a TradingView subscription, an account or a card.
- No subscription. Free to use, with no trial countdown and no paid tier you need to unlock the results.
- No signup. Open the page and start. There is no account to create and no email to hand over.
- Nothing to install. It runs in your browser, and your candle file is processed on your own device.
- Your strategy, your market. Use a ready-made strategy, or paste a TradingView Pine Script strategy and run it here.
Free tool
Backtest your strategy now, free
Pick a strategy, load the free sample or your own candles, and see total PnL, win rate, profit factor and max drawdown in seconds.
Strategy Backtester vs TradingView for backtesting
TradingView is a great charting platform, and its Strategy Tester is popular. If your main goal is simply to find out whether a strategy works, though, a lightweight free tool can get you there faster. Here is how they compare for backtesting.
| Strategy Backtester | TradingView | |
|---|---|---|
| Cost | Free to use | Free tier available. Some features depend on your paid plan. |
| Account needed | No signup | Account required |
| Run a Pine Script strategy | Yes. Paste it and run it. | Yes, built in |
| Ready-made strategies | 13 built-in strategies, no code | Pick or write a script |
| Your own data | Upload Excel or CSV candles, or use the free sample | Uses the platform’s data |
| Costs and slippage | Set commission and slippage per run | Set in the strategy properties |
| Export trades | Trades table to CSV | Export options depend on your plan |
Many traders use both: chart and idea-hunt on TradingView, then validate the numbers here without paying for a plan just to run a test.
What you can backtest for free
You are not limited to one market or one style. The free backtester covers the instruments most retail traders ask about.
- Indian indices: Nifty 50, Bank Nifty and Sensex, with the exchange lot size and rupee results filled in for you.
- Crypto: major coins in USD terms.
- Forex: popular currency pairs with proper pip and lot handling.
- Any other market: choose Custom and upload your own candles.
And you can test many kinds of ideas without writing a line of code. The built-in library includes moving average crossovers, MACD, Supertrend, Donchian breakouts, Parabolic SAR, RSI, Bollinger Bands, Stochastic, opening range breakout and VWAP cross, plus a buy-and-hold benchmark to compare against.
How to backtest a strategy for free in 4 steps
The tool is laid out as four numbered panels. Work through them from top to bottom and press run.
Step 1: Choose a strategy
Open the Strategy panel and pick a built-in strategy. Each one has simple settings you can change, such as the fast and slow averages, plus an optional stop loss, take profit and trailing stop. Already have a TradingView strategy? Switch to the Pine Script option and paste it in.
Step 2: Pick your market
In the Instrument panel, choose Nifty, Bank Nifty, Sensex, a crypto coin or a forex pair. The lot size, tick size and currency are filled in automatically. For anything else, choose Custom.
Step 3: Load candle data
In the Candle data panel, tick the free 12-month sample, or drop in your own Excel or CSV file (up to 50 MB) with timestamp, open, high, low and close columns. Volume is optional. Your file stays in your browser.
Twelve months is perfect for trying the tool and sanity-checking an idea. For a serious test, use several years of your own data or download more history.
Step 4: Set up the test and run
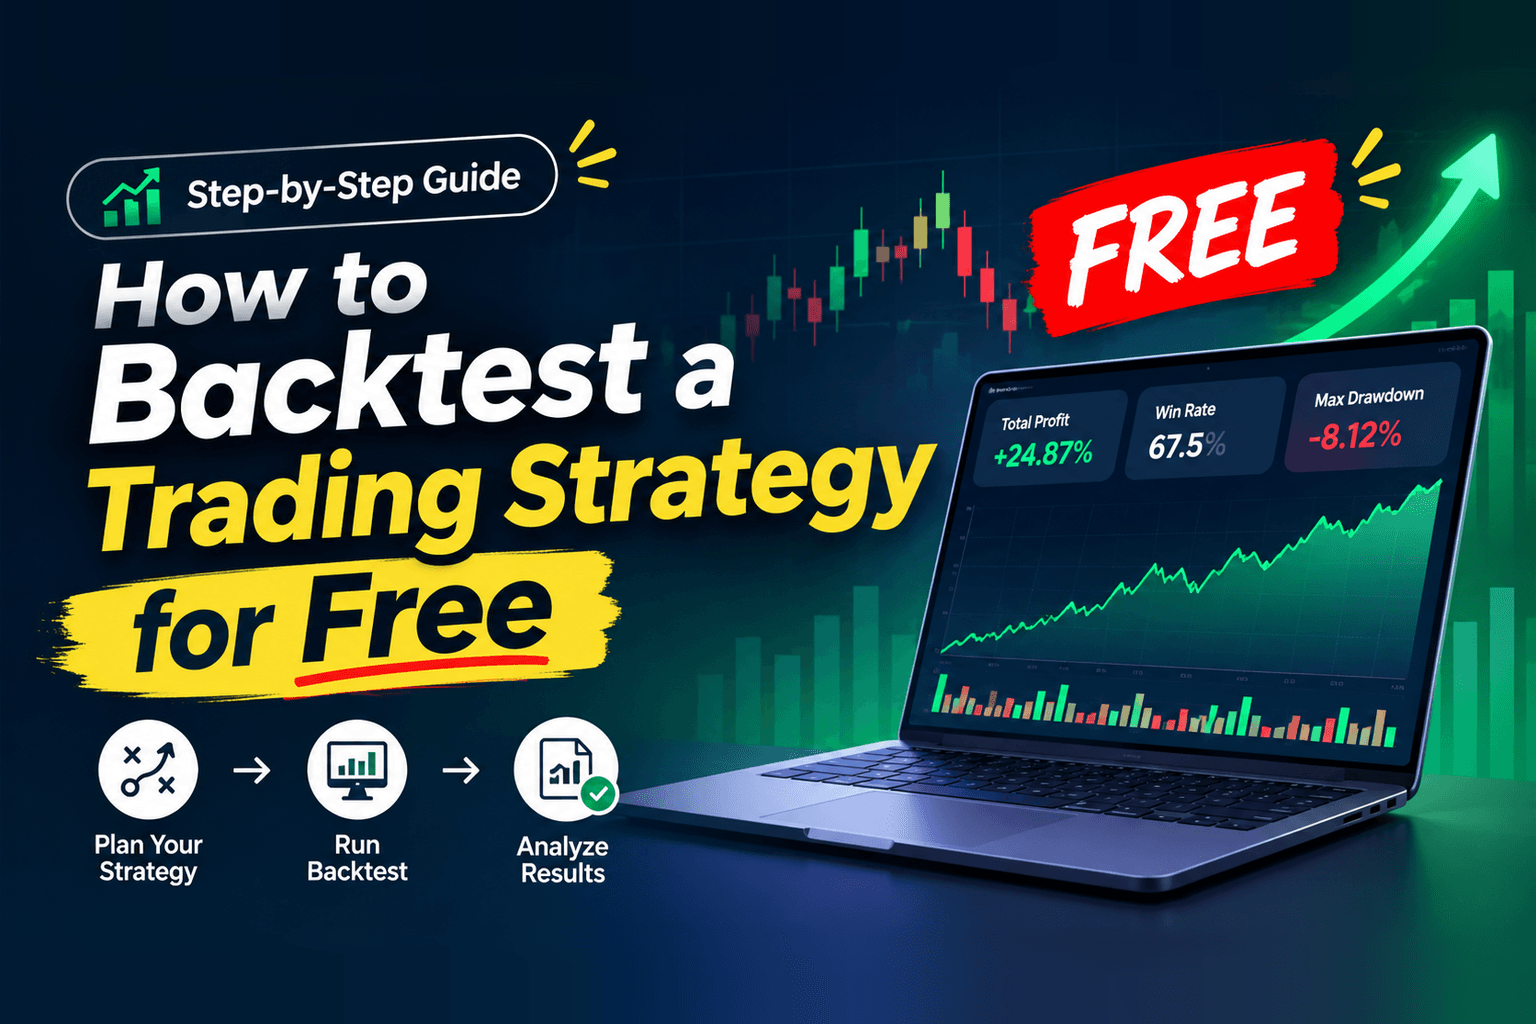
In Test setup, choose the timeframe, how many lots to trade, the date range, and your commission and slippage. Then press run. In a few seconds you get total PnL, win rate, profit factor and max drawdown, followed by exit reasons, every trade in a table, and a month-by-month breakdown you can export to CSV.
Free tool
Ready to see your numbers?
It takes about a minute to set up a first test. Free, with no signup and no subscription.
Add costs, or the result will flatter you
A backtest with no costs measures an imaginary market where every trade is free and every fill is perfect. Real trading has brokerage, taxes and slippage, the small gap between the price you expect and the price you get.
Costs hurt most when a strategy trades often for a small profit each time. This hypothetical strategy averages 4 points of profit per trade before costs. Slippage applies on both entry and exit.
| Slippage per side | Cost per round trip | Average trade after slippage | Verdict |
|---|---|---|---|
| 0 points | 0 points | +4.0 points | Looks strong, but unrealistic |
| 0.5 points | 1 point | +3.0 points | Still positive |
| 1 point | 2 points | +2.0 points | Half the edge is gone |
| 2 points | 4 points | 0.0 points | Break-even before brokerage |
How to read your backtest results
Total profit is only the headline. Read these five in order, because each one catches something the last one hides.
- Total trades. Under 30 is just anecdote. Aim for 100 or more before trusting anything else.
- Profit factor. Gross profit divided by gross loss. Above 1 means it made money after costs. A very high number on few trades is a warning sign, not a prize.
- Max drawdown. The biggest fall from a peak. It is the rough patch you would actually have to sit through.
- Win rate with average win and loss. A low win rate is fine if winners are much bigger than losers, and a high one is not if a single loss erases many wins.
- Exit reasons and the monthly table. Check whether the profit is steady or comes from one lucky month.
Want the formulas and a worked example for each? See our guide to backtesting metrics explained.
Make sure your result is not a fluke
One good run on one period only tells you how the strategy did on that data. Three quick, free checks make the result far more trustworthy.
- Test a different period. Use the From and To dates to run the same strategy on a stretch of data you did not use while tuning it. If it collapses, it was fitted to the past.
- Nudge the settings. Try a fast average of 8 and 10 instead of 9. A sturdy idea survives small changes, while a fragile one only works at one magic number.
- Try a neighbouring timeframe. A real pattern often shows up, in weaker form, on the next timeframe. A fluke usually does not.
This article is for education only and is not financial advice. A backtest is a simulation on historical data and cannot predict future results. See our risk disclaimer.
Frequently asked questions
Is there a free alternative to TradingView for backtesting?
Yes. Strategy Backtester is a free online backtester that needs no TradingView subscription, no signup and no installation. You can run ready-made strategies or paste a Pine Script strategy, test them on your own candles or the free 12-month sample, and see total PnL, win rate, profit factor and max drawdown in seconds.
Can I backtest a strategy without a TradingView subscription?
Yes. You do not need a TradingView plan to use Strategy Backtester. Open the backtester, pick a built-in strategy or paste your Pine Script, load candle data, and run the test directly in your browser.
Is Strategy Backtester really free?
Yes, running backtests is free, with no signup and no subscription. The free 12-month sample data is included for supported instruments. Longer historical data is available separately if you want a deeper test, but it is optional.
Do I need to create an account to backtest?
No. There is no account to create. Open the backtester page and start testing. Your candle file is processed in your browser on your own device.
Can I backtest Nifty and Bank Nifty strategies for free?
Yes. Nifty 50, Bank Nifty and Sensex are supported, with the exchange lot size and rupee results filled in for you. You can use the free 12-month sample or upload your own Excel or CSV candles for a longer test.
Do I need to know how to code to backtest a strategy?
No. The backtester includes 13 built-in strategies such as moving average crossover, RSI, MACD, Supertrend and opening range breakout. You choose one, adjust its settings and press run. Pine Script is optional, for people who already have a TradingView strategy they want to test.
What data do I need to backtest a strategy?
Candle data with a timestamp plus open, high, low and close values. Volume is optional. You can tick the free 12-month sample for supported instruments, or upload an Excel or CSV file up to 50 MB from your broker or charting platform.
How many trades do I need for a reliable backtest?
Aim for at least 100 trades spread over different market conditions. With under 30 trades, the results are closer to anecdote than evidence. Test several years where you can, and confirm the result on a period you did not use while tuning.
Should I include brokerage and slippage in a backtest?
Yes, always. Costs can turn a profitable-looking strategy into a break-even or losing one, especially if it trades often with a small average profit per trade. Enter commission and slippage in the test setup, then retest with slightly worse values to check how fragile the result is.
Why does a backtest look good but fail in live trading?
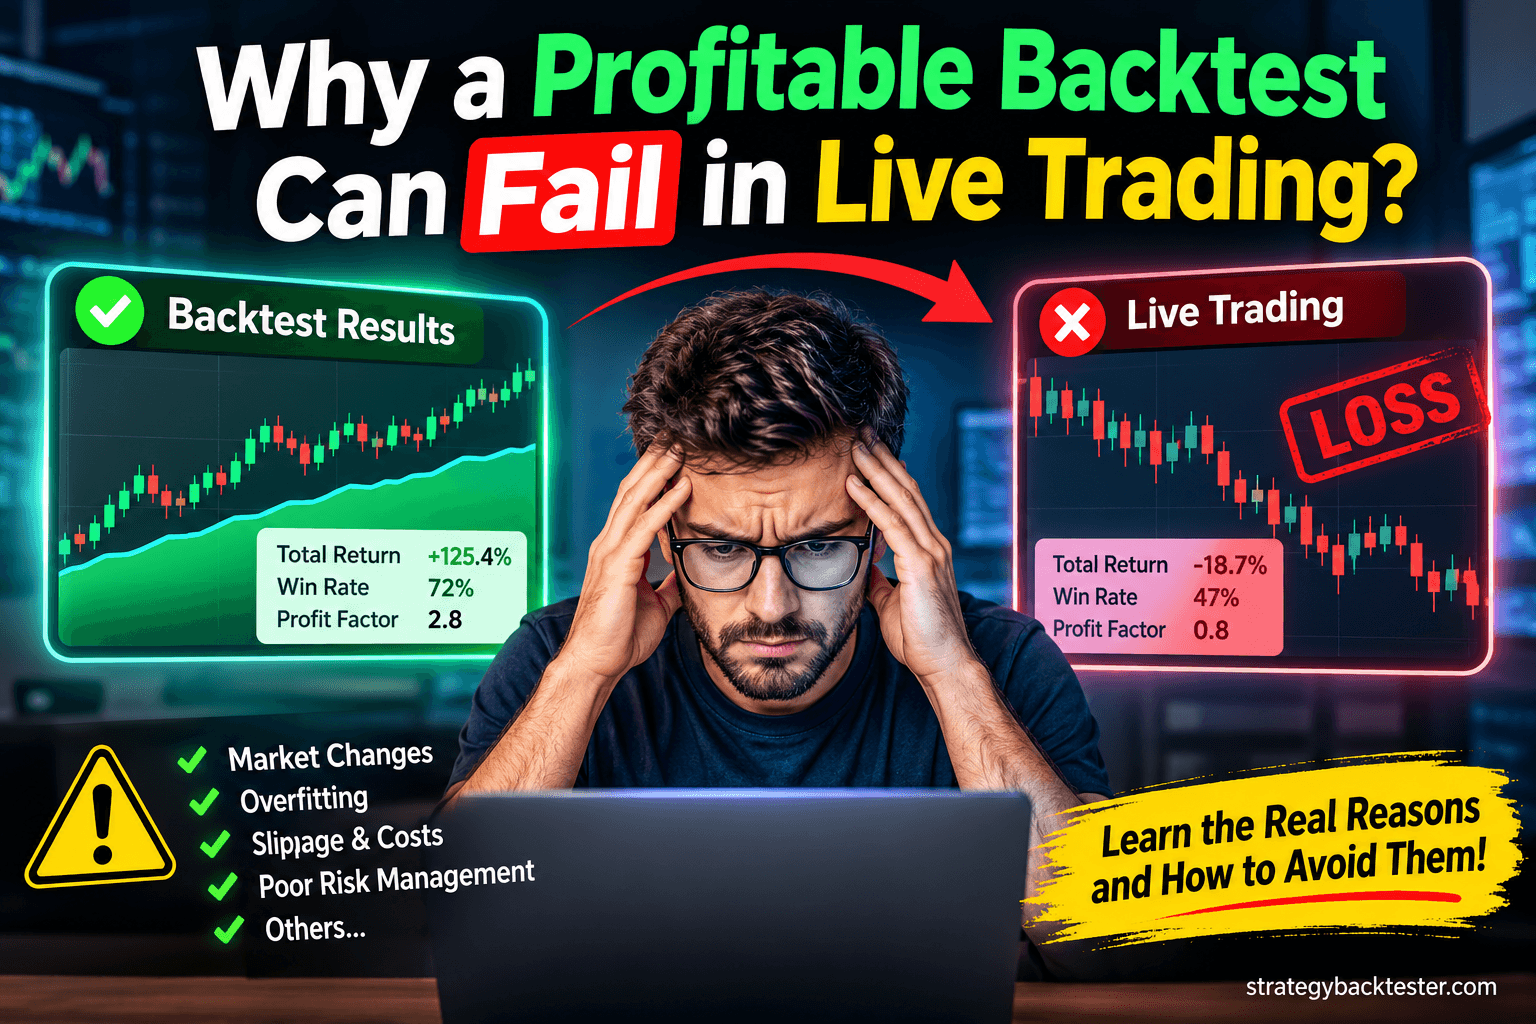
The usual causes are overfitting to past data, ignoring brokerage and slippage, too few trades, and testing in only one kind of market. Run the strategy on a separate date range, include realistic costs, and compare your live drawdown with the worst case from the backtest.